Updated Charts: Taiwan Arms Sales 1990-2021


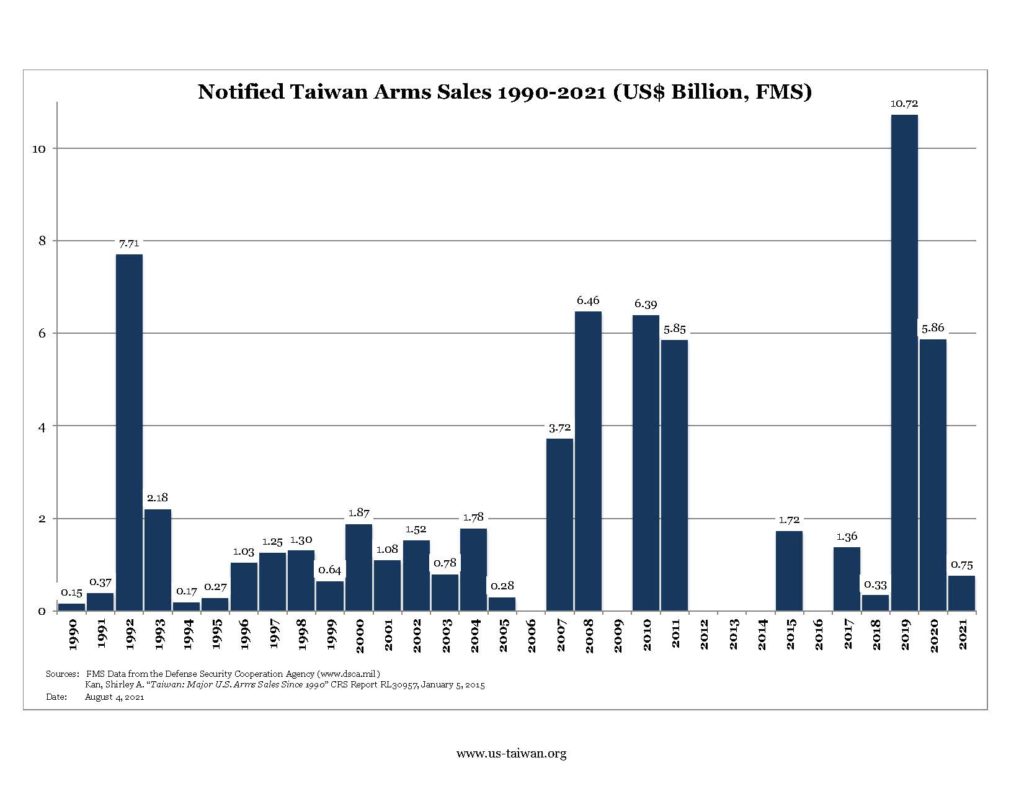
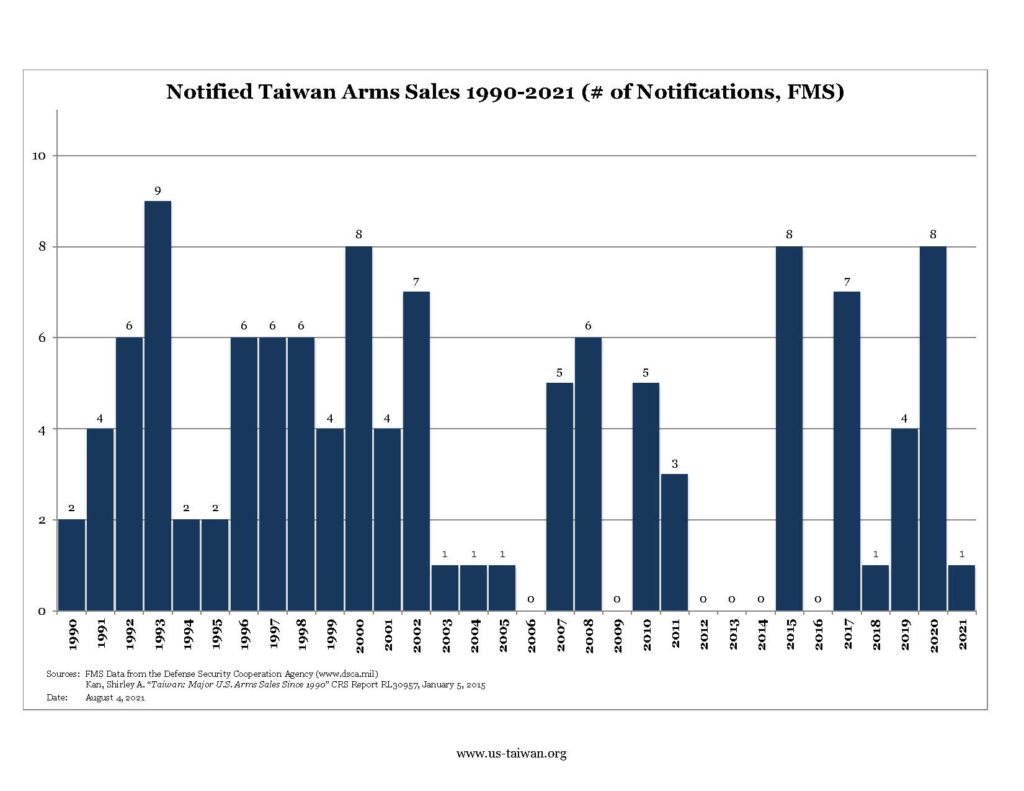
Taiwan Arms Sales notified to Congress from 1990 to August 4, 2021. Foreign Military Sales (FMS) only, in US$ billion and by number of notifications.
Sources:
– FMS Data from the Defense Security Cooperation Agency at http://www.dsca.mil
– Kan, Shirley A., “Taiwan: Major U.S. Arms Sales Since 1990” Congressional Research Service Report RL30957, January 5, 2015
Note that the gaps in notifications were as follows:
October 25, 2005 – February 28, 2007
October 3, 2008 – January 29, 2010
September 21, 2011 – December 16, 2015
December 16, 2015 – June 29, 2017
